本文将讲解如何使用 wireshark 查看 tcpdump 的抓包结果
保存 tcpdump 抓包结果
sudo tcpdump -i eth0 -w dump.pcap
-i指定要抓取的网卡-w指定结果保存位置$ sudo tcpdump -i eth0 -w dump.pcap -v tcpdump: listening on eth0, link-type EN10MB (Ethernet), capture size 65535 bytes Got 15
-v主要是为了得到Got 15这个数,当想要停止的时候,按下ctrl + c就可以了:$ sudo tcpdump -i eth0 -w dump.pcap -v tcpdump: listening on eth0, link-type EN10MB (Ethernet), capture size 65535 bytes ^C71 packets captured 71 packets received by filter 0 packets dropped by kernel
然后用 sz 命令或其他方式把 dump.pcap 文件下载到本地:
sz dump.pcap
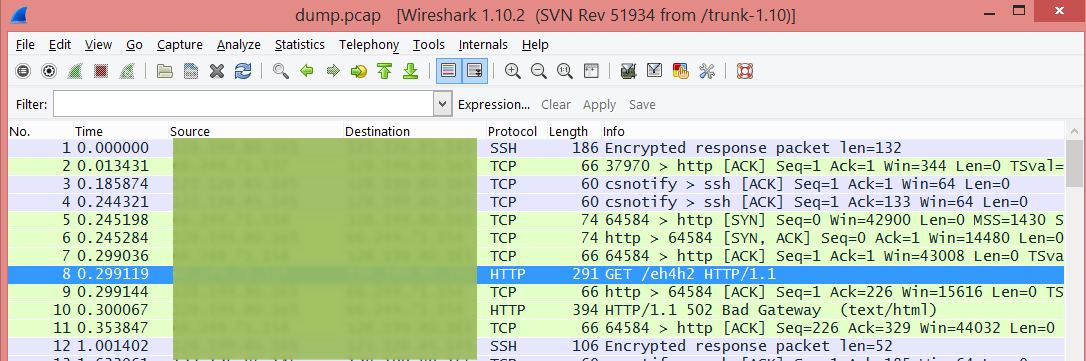
在 wireshark 中打开
【file】—【open】选中 dump.pcap 文件就可以查看抓包结果了。

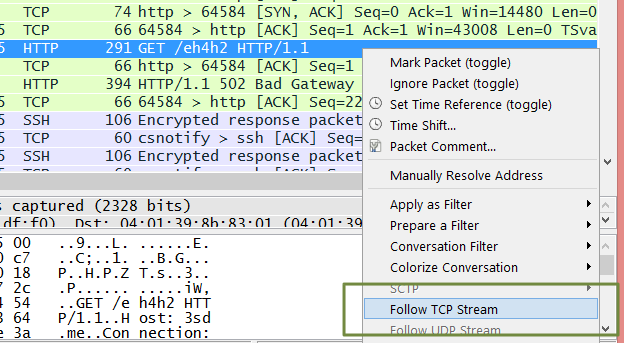
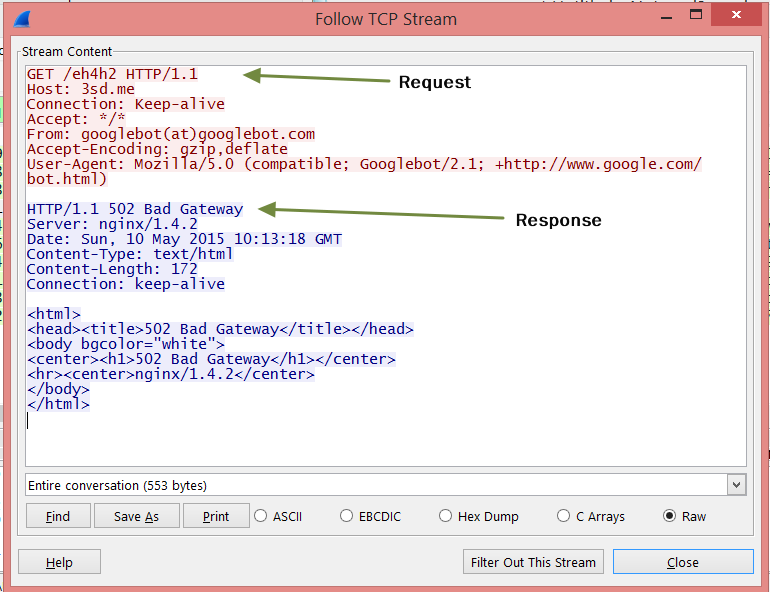
顺便说一个查看 http 请求和响应的方法:
其他 tcpdump 技巧
抓取本机进程发往指定端口的请求:
sudo tcpdump dst port 8000
过滤 http 请求和响应:
sudo tcpdump host 3sd.me and port 80 -v
过滤 GET 请求:
sudo tcpdump host 3sd.me and port 80 and 'tcp[((tcp[12:1] & 0xf0) >> 2):4] = 0x47455420'
过滤 POST 请求:
sudo tcpdump host 3sd.me and port 80 and 'tcp dst port 80 and (tcp[((tcp[12:1] & 0xf0) >> 2):4] = 0x504f5354)'
使用 -A 参数使返回值人类可读
$ sudo tcpdump -A host 3sd.me and port 80 and 'tcp[((tcp[12:1] & 0xf0) >> 2):4] = 0x47455420'
tcpdump: verbose output suppressed, use -v or -vv for full protocol decode
listening on eth0, link-type EN10MB (Ethernet), capture size 65535 bytes
18:41:59.219052 IP xxx.xxx.xxx.xxxx > 3sd.me.http: Flags [P.], seq 2875869606:2875869979, ack 2796606839, win 64240, length 373
E.....@.r..Gh..j..P....P.jI....wP....7..GET /JbVGP HTTP/1.1
Host: 3sd.me
Connection: Keep-Alive
User-Agent: Mozilla/5.0 (Macintosh; Intel Mac OS X 10.9; rv:35.0) Gecko/20100101 Firefox/35.0
Accept: text/html, application/xml;q=0.9, application/xhtml+xml, image/png, image/webp, image/jpeg, image/gif, image/x-xbitmap, */*;q=0.1
Accept-Language: en
Accept-Encoding: gzip, deflate
Referer: http://3sd.me/
更多过滤规则请参考 https://wiki.wireshark.org/CaptureFilters
参考资料
- https://wiki.wireshark.org/CaptureFilters
- https://www.wireshark.org/docs/wsug_html_chunked/AppToolstcpdump.html
- https://www.wireshark.org/tools/string-cf.html
- https://sites.google.com/site/jimmyxu101/testing/use-tcpdump-to-monitor-http-traffic
- http://stackoverflow.com/questions/4777042/can-i-use-tcpdump-to-get-http-requests-response-header-and-response-body
- http://askubuntu.com/questions/252179/how-to-inspect-outgoing-http-requests-of-a-single-application>
Comments